Interim reading, 18 November 2026
Belgian listings barometer, 1 to 18 November 2026: 2.2% of asking prices cut
2.2%From 1 to 18 November, the asking price fell on 1,029 of the 47,438 Immoweb ads read with a price on both dates, by a median 5.4% (€19,000). It rose on 123.
- 86,567homes for sale on Immoweb on 18 November, as many as on 26 October
- 2,181ads went under offer from 1 to 18 November: 5.3% of the 41,352 read on both dates without the badge on 1 November
- 1.6ads for every 100 houses and flats in Belgium, on 18 November
Homes for sale since 14 October 2026
On 18 November, Immoweb had 51,153 houses and 35,414 flats for sale, 86,567 homes in all, as many as on 26 October. That’s 1.6 ads for every 100 houses and flats in the country.
In the communes where the sweep read every ad, which hold 52,292 of the 86,567 homes for sale, 12,042 new ads came on Immoweb from 1 to 18 November. 7,762 left it between 1 and 13 November and were still gone on 18 November; 1,614 of them were under offer when last seen.
Price cuts by province
The share of the ads read with a price on 1 and 18 November whose asking price was cut in between, and the median cut. The largest share: Hainaut, 2.8%. The smallest: Walloon Brabant, 1.6%.
Regions and provinces
Homes for sale
| Area | For sale, 18 Nov | Change since 26 Oct | Per 100 homes |
|---|---|---|---|
| Belgium | 86,567 | 0 | 1.6 |
| Brussels-Capital | 9,600 | +40 | 1.7 |
| Flanders | 52,332 | +264 | 1.6 |
| Antwerp | 13,089 | +107 | 1.5 |
| Flemish Brabant | 7,831 | +43 | 1.5 |
| West Flanders | 15,692 | −194 | 2.3 |
| East Flanders | 11,460 | +162 | 1.5 |
| Limburg | 4,260 | +146 | 1.0 |
| Wallonia | 24,635 | −304 | 1.4 |
| Walloon Brabant | 2,984 | +13 | 1.6 |
| Hainaut | 8,326 | −149 | 1.3 |
| Liège | 7,803 | −139 | 1.5 |
| Luxembourg | 2,116 | −75 | 1.5 |
| Namur | 3,406 | +46 | 1.5 |
Asking prices
Cuts and rises from 1 to 18 November, on the ads read with a price on both dates; the median asking price per m² on 18 November.
| Area | Price cut | Median cut | Price rises | Went under offer | Flats, €/m² | Houses, €/m² |
|---|---|---|---|---|---|---|
| Belgium | 2.2% | 5.4% | 123 | 5.3% | €3,194 | €2,194 |
| Brussels-Capital | 2.6% | 5.1% | 5 | 7.2% | €3,608 | €2,870 |
| Flanders | 2.0% | 4.8% | 40 | 4.5% | €3,325 | €2,355 |
| Antwerp | 2.0% | 4.2% | 7 | 6.6% | €3,322 | €2,484 |
| Flemish Brabant | 2.4% | 4.6% | 7 | 5.3% | €3,535 | €2,641 |
| West Flanders | 2.3% | 5.9% | 9 | 2.5% | €3,436 | €2,132 |
| East Flanders | 1.6% | 4.8% | 14 | 5.4% | €3,225 | €2,312 |
| Limburg | 1.7% | 5.1% | 3 | 2.9% | €2,981 | €2,049 |
| Wallonia | 2.3% | 6.5% | 78 | 6.5% | €2,586 | €1,824 |
| Walloon Brabant | 1.6% | 6.3% | 2 | 8.1% | €3,317 | €2,667 |
| Hainaut | 2.8% | 6.6% | 40 | 5.7% | €2,034 | €1,500 |
| Liège | 2.4% | 6.3% | 3 | 7.2% | €2,429 | €1,786 |
| Luxembourg | 2.1% | 7.7% | 2 | 6.3% | €2,815 | €1,916 |
| Namur | 2.0% | 8.0% | 31 | 6.0% | €2,895 | €1,875 |
Communes
Every commune with at least 200 homes for sale on 18 November, and the 19 communes of Brussels. Between 26 October and 18 November, the number of homes for sale rose in 55 of these 100 communes and fell in 41. Price cuts count the ads read with a price on 1 and 18 November: as a share where at least 200 of them were and at least 10 were cut, as a number elsewhere. The largest rises: Andenne (+26.2%), Denderleeuw (+18.5%) and Lokeren (+12.9%). The largest falls: Geel (−12.1%), Herstal (−10.6%) and La Louvière (−7.4%).
The 100 communes, by homes for sale
| Commune | For sale, 18 Nov | Change since 26 Oct | Per 100 homes | Price cuts | Flats, €/m² | Houses, €/m² |
|---|---|---|---|---|---|---|
| Antwerp | 4,387 | +58 | 1.6 | 2 of 41 | €3,186 | €2,500 |
| City of Brussels | 2,925 | +3 | – | 9 of 609 | €4,508 | €3,247 |
| Knokke-Heist | 2,438 | −182 | 5.9 | 3 of 198 | €9,947 | €6,290 |
| Liège | 2,023 | −22 | 1.9 | 4 of 291 | €2,343 | €1,674 |
| Ghent | 1,922 | +74 | 1.3 | 1 of 79 | €4,211 | €3,120 |
| Ostend | 1,396 | −15 | 2.6 | 4.2% | €3,333 | €1,801 |
| Charleroi | 1,379 | +6 | 1.4 | 3.5% | €1,523 | €1,268 |
| Bruges | 1,184 | +17 | 1.9 | 5 of 252 | €3,819 | €2,404 |
| Uccle | 1,180 | +27 | 2.8 | 3 of 263 | €4,412 | €3,909 |
| Ixelles | 1,086 | +38 | 2.2 | 5 of 268 | €4,744 | €3,796 |
| Leuven | 993 | +45 | 1.5 | 2 of 310 | €5,237 | €3,225 |
| Anderlecht | 867 | −10 | 1.7 | 3 of 344 | €2,835 | €2,250 |
| Kortrijk | 851 | +20 | 2.2 | 3 of 307 | €3,591 | €1,941 |
| Aalst | 832 | −8 | 2.0 | 2 of 272 | €2,917 | €2,038 |
| Namur | 794 | −8 | 1.4 | 5 of 325 | €3,115 | €2,358 |
| Schaerbeek | 779 | −3 | 1.4 | 5 of 333 | €3,368 | €2,446 |
| Middelkerke | 739 | −5 | 2.8 | 3.7% | €4,273 | €2,494 |
| Koksijde | 705 | +10 | 2.5 | 7 of 281 | €4,128 | €3,677 |
| Blankenberge | 691 | +4 | 3.7 | 0 of 216 | €3,316 | €1,868 |
| Roeselare | 674 | −6 | 2.2 | 2 of 321 | €2,524 | €1,827 |
| Tournai | 628 | +20 | 1.7 | 3.6% | €2,277 | €1,639 |
| Molenbeek-Saint-Jean | 601 | −6 | 1.6 | 7 of 257 | €2,618 | €2,306 |
| Seraing | 594 | −19 | 1.9 | 7 of 342 | €2,794 | €1,566 |
| Sint-Niklaas | 576 | +4 | 1.6 | 4 of 284 | €2,670 | €2,216 |
| Mouscron | 571 | +16 | 2.1 | 4.3% | €1,932 | €1,473 |
| Mechelen | 551 | +3 | 1.3 | 5 of 279 | €3,533 | €2,758 |
| Hasselt | 490 | +1 | 1.1 | 2 of 295 | €3,472 | €2,287 |
| Beveren-Kruibeke-Zwijndrecht | 468 | −25 | 1.2 | 5 of 259 | €2,920 | €2,340 |
| Turnhout | 453 | −5 | 2.0 | 3 of 291 | €2,826 | €2,006 |
| Mons | 453 | +7 | 0.9 | 4 of 255 | €2,357 | €1,567 |
| Nieuwpoort | 441 | −1 | 2.6 | 6 of 246 | €5,000 | €2,790 |
| Woluwe-Saint-Lambert | 439 | +3 | 1.4 | 7 of 217 | €4,286 | €3,409 |
| Verviers | 430 | +3 | 1.7 | 4.3% | €2,067 | €1,574 |
| Geraardsbergen | 427 | +17 | 2.6 | 2 of 189 | €2,742 | €1,883 |
| De Panne | 409 | −6 | 2.9 | 4.2% | €3,868 | €2,526 |
| Tongeren-Borgloon | 402 | +18 | 2.0 | 4 of 289 | €2,821 | €1,699 |
| Deinze | 391 | +1 | 1.8 | 5 of 267 | €3,854 | €2,562 |
| La Louvière | 389 | −31 | 1.1 | 7 of 248 | €1,718 | €1,316 |
| Evere | 383 | +25 | 1.9 | 3 of 197 | €3,710 | €2,469 |
| Ronse | 379 | +18 | 3.0 | 3 of 219 | €2,679 | €1,619 |
| Lier | 371 | +8 | 2.0 | 7 of 260 | €3,391 | €2,500 |
| Waregem | 362 | −22 | 1.9 | 2 of 258 | €3,250 | €2,112 |
| Braine-l’Alleud | 359 | +17 | 2.0 | 1 of 257 | €3,700 | €2,770 |
| Ninove | 356 | +5 | 2.0 | 5 of 248 | €3,358 | €2,026 |
| Forest | 352 | −10 | 1.3 | 5.5% | €3,438 | €2,671 |
| Etterbeek | 351 | +9 | 1.4 | 4 of 242 | €4,563 | €2,861 |
| Woluwe-Saint-Pierre | 350 | +7 | 1.7 | 6 of 262 | €4,538 | €3,821 |
| Sint-Truiden | 349 | +7 | 1.8 | 5.4% | €2,900 | €1,969 |
| Jette | 345 | −6 | 1.5 | 9 of 234 | €2,900 | €2,528 |
| Asse | 319 | +21 | 2.2 | 5 of 236 | €2,878 | €2,602 |
| Willebroek | 317 | +8 | 2.5 | 1 of 234 | €3,125 | €2,393 |
| Herstal | 312 | −37 | 1.8 | 2 of 258 | €1,931 | €1,606 |
| Dendermonde | 306 | +17 | 1.4 | 4 of 223 | €3,356 | €2,030 |
| Saint-Gilles | 303 | +6 | 1.3 | 6.6% | €4,031 | €2,500 |
| Puurs-Sint-Amands | 302 | −1 | 2.5 | 7 of 219 | €3,468 | €2,540 |
| Oudenaarde | 297 | −1 | 1.9 | 5 of 210 | €2,981 | €1,995 |
| Brasschaat | 287 | −13 | 1.6 | 6 of 181 | €3,716 | €3,143 |
| Dilbeek | 280 | −11 | 1.5 | 4 of 210 | €3,181 | €2,829 |
| Waterloo | 276 | +1 | 2.1 | 4 of 218 | €4,198 | €3,250 |
| Lokeren | 271 | +31 | 1.2 | 5 of 182 | €3,386 | €2,445 |
| Vilvoorde | 268 | +2 | 1.4 | 9 of 205 | €3,267 | €2,328 |
| Tielt | 265 | −2 | 1.8 | 3 of 183 | €3,139 | €2,008 |
| De Haan | 264 | −18 | 1.8 | 1 of 200 | €3,959 | €3,057 |
| Beringen | 263 | −6 | 1.3 | 1 of 173 | €2,671 | €2,036 |
| Mol | 262 | −4 | 1.5 | 8 of 188 | €3,173 | €2,098 |
| Arlon | 256 | −8 | 1.7 | 7 of 206 | €3,300 | €2,250 |
| Heist-op-den-Berg | 254 | +19 | 1.2 | 5 of 167 | €3,476 | €2,283 |
| Harelbeke | 252 | −5 | 1.8 | 4 of 174 | €2,559 | €1,806 |
| Zaventem | 251 | 0 | 1.6 | 11 of 190 | €3,950 | €2,622 |
| Tienen | 251 | +12 | 1.5 | 3 of 186 | €2,823 | €1,850 |
| Izegem | 249 | −18 | 1.8 | 4 of 197 | €2,471 | €1,606 |
| Halle | 248 | −2 | 1.3 | 1 of 200 | €2,862 | €2,556 |
| Wavre | 248 | +4 | 1.6 | 2 of 193 | €3,214 | €2,616 |
| Grimbergen | 247 | −4 | 1.4 | 3 of 185 | €3,028 | €2,803 |
| Menen | 245 | +9 | 1.6 | 3 of 173 | €2,300 | €1,683 |
| Scherpenheuvel-Zichem | 238 | +5 | 2.1 | 3 of 183 | €3,413 | €2,040 |
| Mortsel | 237 | +3 | 1.9 | 3 of 159 | €3,450 | €2,910 |
| Nivelles | 233 | +2 | 1.6 | 4 of 195 | €2,708 | €2,332 |
| Schilde | 229 | +9 | 2.6 | 1 of 152 | €4,063 | €3,208 |
| Auderghem | 227 | +3 | 1.3 | 2 of 159 | €4,600 | €3,448 |
| Ypres | 227 | −7 | 1.3 | 7 of 160 | €3,106 | €1,827 |
| Zwevegem | 227 | 0 | 1.9 | 5 of 174 | €3,571 | €2,000 |
| Geel | 225 | −31 | 1.1 | 3 of 150 | €3,205 | €2,181 |
| Bredene | 225 | 0 | 2.1 | 6 of 160 | €3,208 | €2,211 |
| Wetteren | 225 | +11 | 1.8 | 3 of 152 | €3,258 | €2,335 |
| Denderleeuw | 224 | +35 | 2.5 | 3 of 137 | €3,188 | €2,209 |
| Genk | 222 | 0 | 0.8 | 3 of 144 | €2,924 | €1,974 |
| Andenne | 217 | +45 | 1.7 | 3 of 139 | €2,920 | €1,835 |
| Sint-Pieters-Leeuw | 216 | +6 | 1.5 | 6 of 157 | €3,271 | €2,766 |
| Flémalle | 216 | +4 | 1.7 | 3 of 171 | €2,421 | €1,758 |
| Berchem-Sainte-Agathe | 213 | +9 | 2.0 | 4 of 154 | €2,860 | €2,647 |
| Boom | 205 | −2 | 2.4 | 3 of 136 | €2,819 | €2,237 |
| Kapellen | 202 | +10 | 1.6 | 6 of 133 | €3,557 | €2,972 |
| Evergem | 202 | −4 | 1.3 | 4 of 136 | €3,396 | €2,705 |
| Temse | 202 | +6 | 1.5 | 4 of 134 | €2,670 | €2,358 |
| Courcelles | 200 | −9 | 1.4 | 7 of 164 | €1,989 | €1,333 |
| Koekelberg | 189 | +9 | 2.0 | 5 of 133 | €2,714 | €2,381 |
| Ganshoren | 180 | −11 | 1.5 | 3 of 142 | €2,664 | €2,329 |
| Saint-Josse-ten-Noode | 135 | −5 | 1.4 | 4 of 97 | €3,467 | €2,258 |
| Watermael-Boitsfort | 132 | −1 | 1.1 | 4 of 100 | €4,126 | €3,869 |
Weighing up a home on Immoweb?
Paste the link of a home on Immoweb, Belgium’s main property site, and get a free 11-page report: the asking price checked against comparable listings and recorded sales, the true monthly cost, and the red flags.
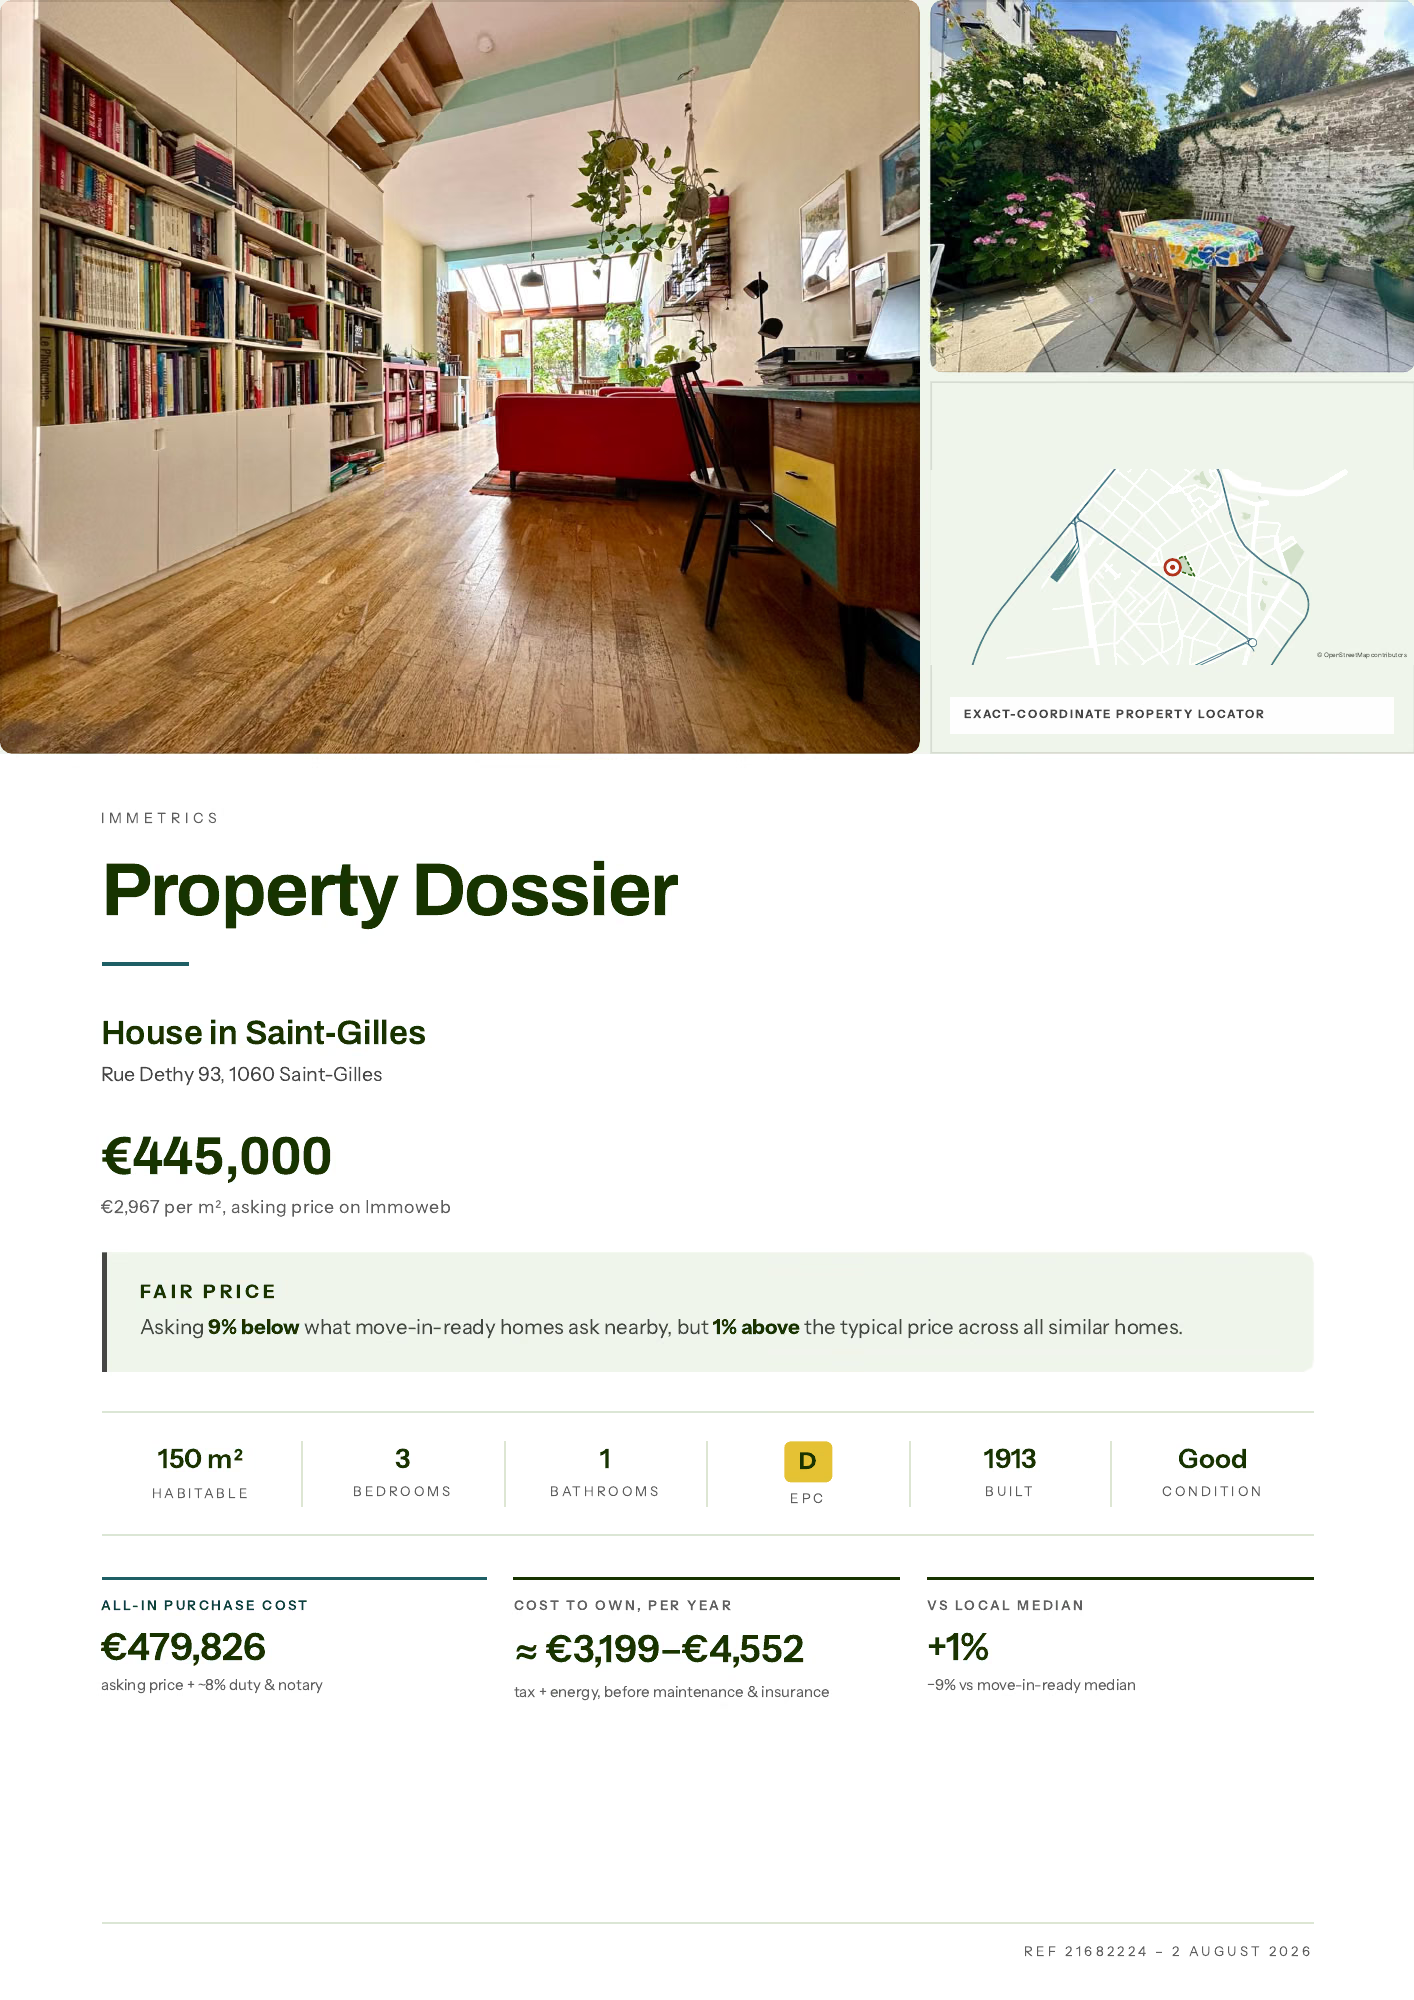 the verdictOpen the full 11-page sample
How the barometer is made
- Source
- immetrics reads Immoweb’s search results for every commune, houses and flats apart. The barometer rests on the sweeps of 1, 13 and 18 November 2026, and on Immoweb’s own count of the homes for sale at every sweep since 14 October 2026. On 18 November the sweep read 67,337 of the 86,567 ads; the communes where it read every ad at every sweep hold 52,292 of them.
- Homes for sale
- Immoweb’s count of the ads in each commune’s search on the day of a sweep. An ad in a postal code two communes share is in both their searches, so it counts in both commune rows; Belgium, the regions and the provinces count it once, in the commune whose only code it is: 1040 in Etterbeek, 1050 in Ixelles.
- Ads per 100 homes
- The homes for sale over the dwellings in houses and in apartment buildings that Statbel’s cadastral building stock counts on 1 January 2026. Statbel
- Price cut
- A price at least 1% and at most 50% below the same ad’s price at the sweep before, the rule Redfin uses in the United States. The share is of the ads read with a price at the first and the last sweep, 1 and 18 November; an ad counts once, however many cuts it had. The median cut is that of each ad’s largest cut. A rise follows the same bounds.
- New and gone ads
- New: not on Immoweb at the first sweep, there at a later one. Gone: missing from at least two sweeps in a row. A home listed again under a new ad counts as gone and as new. Both are counted only where the sweep read every ad of a commune’s houses, or of its flats, on every date.
- Under offer
- Immoweb’s “under offer” badge. The figure is the ads that wore it on 18 November and not on 1 November, of those read on both dates without it on 1 November. Agencies use the badge far more in some provinces than in others, so it’s a figure to follow in one area from month to month.
- New developments
- A development listed as one ad counts in the homes for sale and in new and gone ads, and in no price figure.
- Asking price per m²
- The median of the ads read on 18 November with a price from €40,000 to €5,000,000 and a surface from 20 m² to 1,000 m²: the price sellers ask.
- Sample rules
- A share is given on at least 200 ads with at least 10 events, a median on at least 20 values; below that the page gives the count. A commune with fewer than 20 homes for sale shows its stock alone.
Download the figures
One CSV file holds every figure of this reading with its base: Belgium, the 3 regions, the 10 provinces and all 555 communes, houses and flats apart. It’s free to reuse under CC BY 4.0, with immetrics.be named as the source.
immetrics-listings-barometer-2026-11-18.csv (CC BY 4.0)
To cite it: immetrics.be, Belgian listings barometer, 1 to 18 November 2026, https://immetrics.be/property-prices/barometer
Next editions
This interim reading runs to 18 November 2026. The November 2026 edition reads the month to its last sweep.
- November 2026 edition: Tuesday 8 December 2026
- December 2026 edition: Tuesday 5 January 2027
- January 2027 edition: Tuesday 2 February 2027
- February 2027 edition: Tuesday 2 March 2027