Official sale prices – Flanders
Property prices in Flemish Brabant province
In 2025, the median sale price across Flemish Brabant province was €400,000 for a house (11,091 sales) and €284,500 for an apartment (4,282 sales), according to Statbel.
Median house, first half of 2026
€415,000
+5.1% on Jan–Jun 2025 (€395,000), 4,971 sales
Median house, 2025
€400,000
Middle 50% of sales: €309,000–€525,000
Median apartment, first half of 2026
€295,000
+5.1% on Jan–Jun 2025 (€280,750), 2,031 sales
Median apartment, 2025
€284,500
Middle 50% of sales: €225,000–€350,000
Bought at the 2025 median of €400,000 as your only home, a house in Flemish Brabant province costs about €412,000 all-in, with registration tax and notary fees. Borrowing 80% of the price adds about €6,400 for the mortgage deed. The true cost of buying a home in Belgium, item by item
Work out what your savings and income can buy
Eyeing a home in Flemish Brabant province?
Paste the link of a home on Immoweb, Belgium’s main property site, and get a free 11-page report: the asking price checked against comparable listings and recorded sales, the true monthly cost, and the red flags.
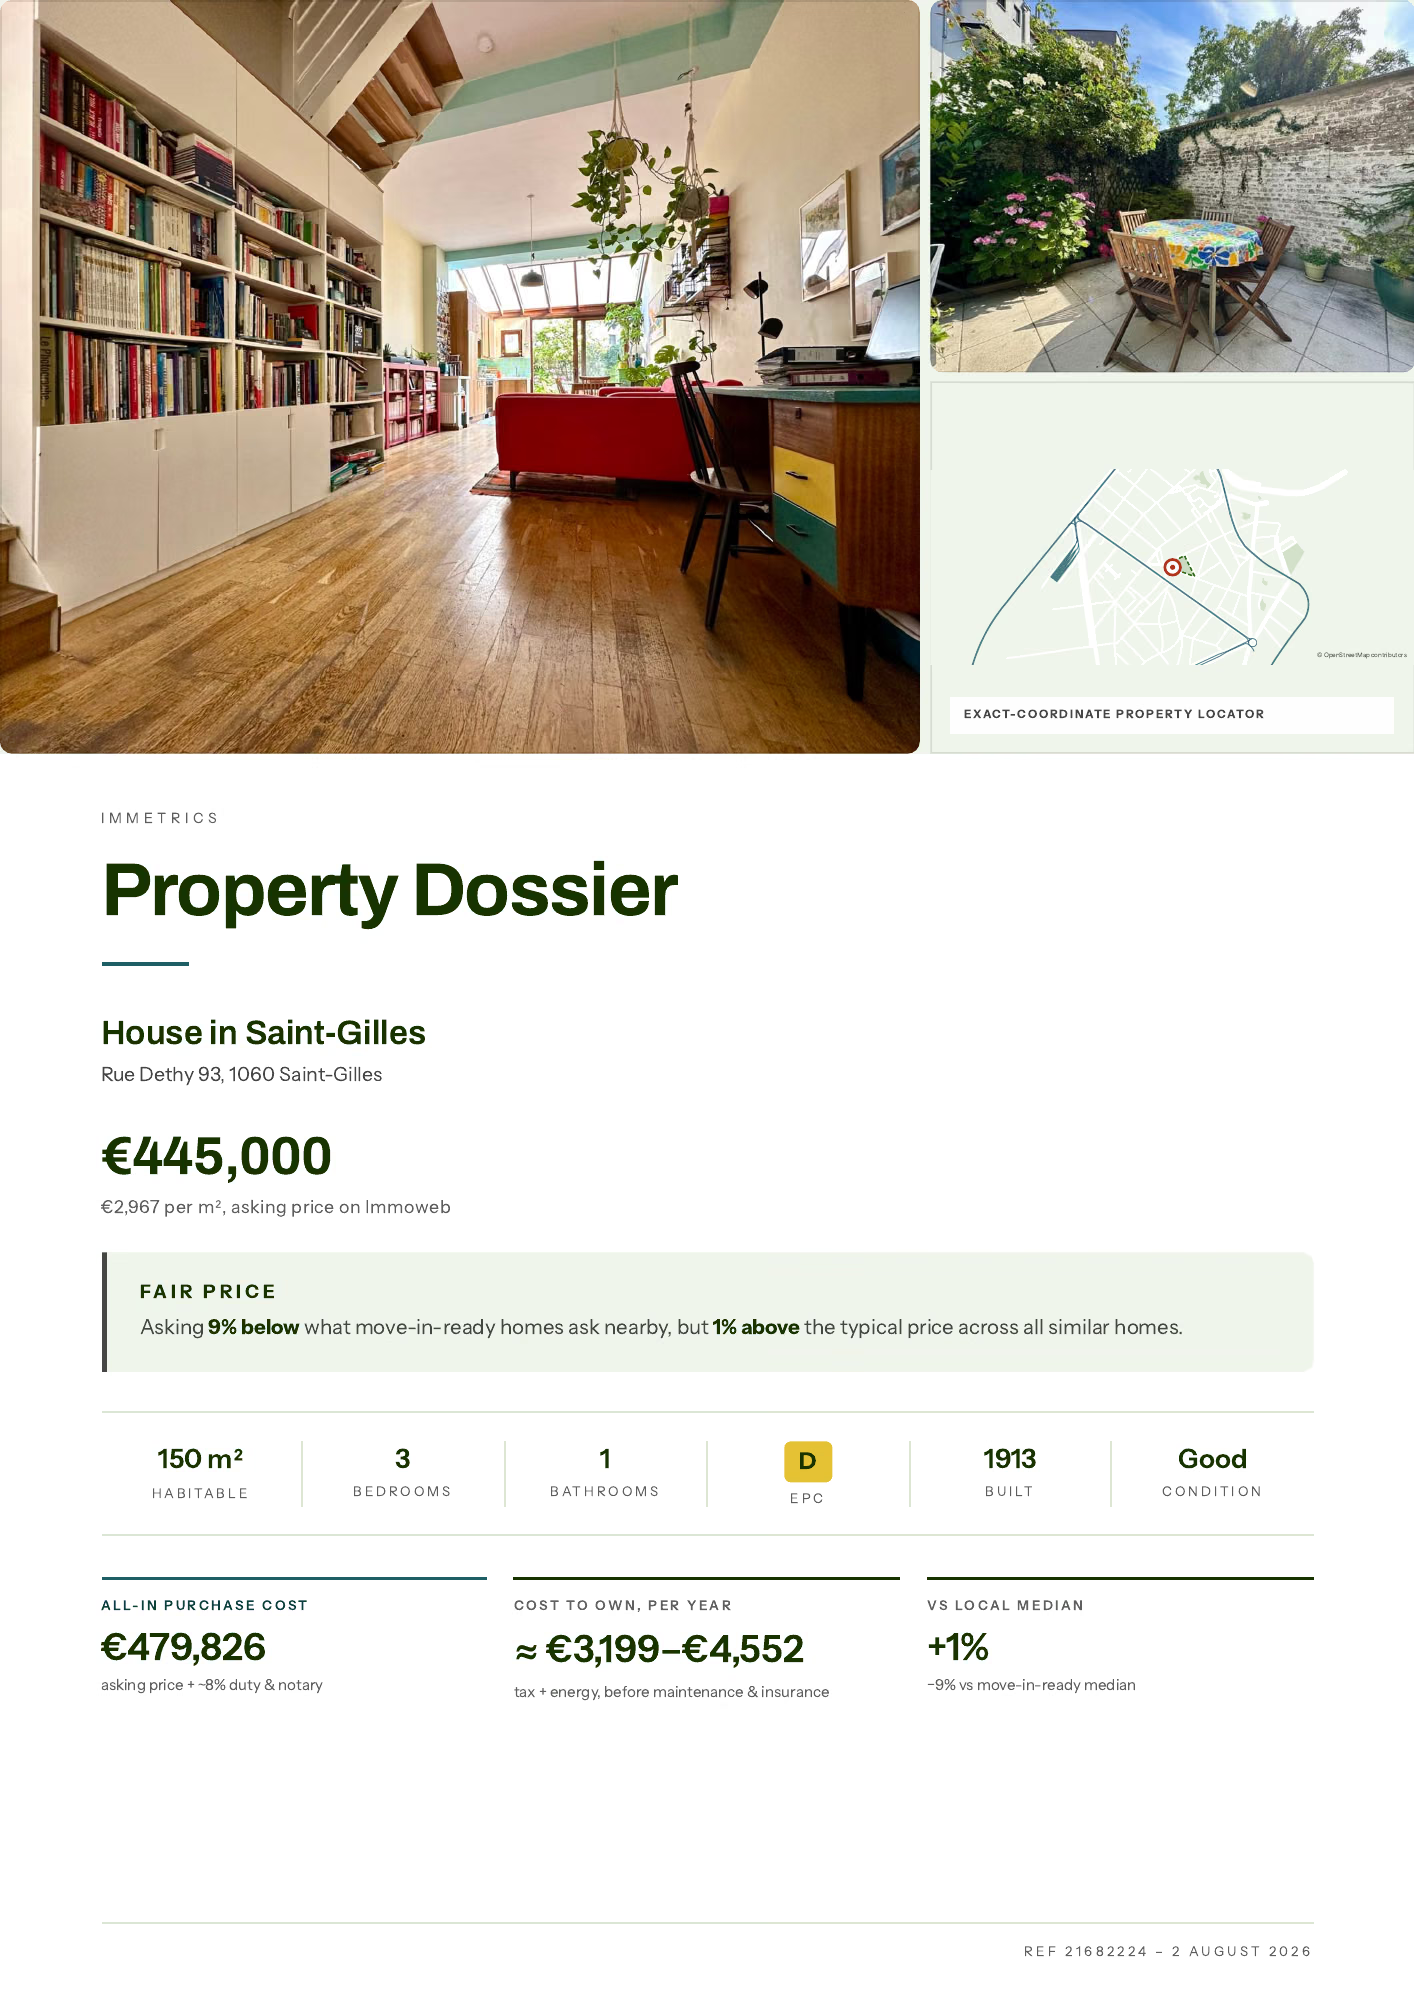 The verdict up front: where the asking price sits, the cash you need on day one, and what it costs each monthOpen the full 11-page sample
Median sale price in Flemish Brabant since 2010
HousesApartmentsShaded: middle 50% of sales
Will house prices fall in Flemish Brabant province in 2026?
Not so far. In the first half of 2026, the median house in Flemish Brabant province sold for €415,000 on 4,971 sales, 5.1% more than in the first half of 2025 (€395,000 on 5,519 sales). The median apartment sold for €295,000 on 2,031 sales, 5.1% more than in the first half of 2025 (€280,750 on 2,159 sales). On 26 October 2026, Immoweb listed 5,352 houses and 2,436 apartments for sale in Flemish Brabant province.
Map of house prices in Flemish Brabant province (2025)
- €250,000 to €340,000
- €340,000 to €380,000
- €380,000 to €430,000
- €430,000 to €460,000
- €460,000 to €640,000
Which are the cheapest communes in Flemish Brabant province?
Zoutleeuw is the cheapest commune in Flemish Brabant province: its median house sold for €252,000 in 2025.
- Zoutleeuw€252,000
- Bever€262,500
- Tienen€273,750
- Landen€280,000
- Diest€285,000
- Kortenaken€290,000
- Scherpenheuvel-Zichem€295,000
- Linter€300,000
- Geetbets€304,500
- Bekkevoort€317,500
Working in a city? The guide to affordable communes near Belgium’s big cities compares the communes around each one by price.
Which are the most expensive communes in Flemish Brabant province?
Kraainem is the most expensive commune in Flemish Brabant province: its median house sold for €640,000 in 2025.
- Kraainem€640,000
- Tervuren€597,500
- Wezembeek-Oppem€592,500
- Sint-Genesius-Rode€572,500
- Overijse€530,000
- Linkebeek€505,000
- Bertem€483,500
- Wemmel€482,500
- Hoeilaart€477,500
- Keerbergen€475,000
Where have house prices risen most in Flemish Brabant province?
Of the 61 communes in Flemish Brabant province with at least 30 house sales in both 2020 and 2025, the median house rose most in Boortmeerbeek: +48.4% since 2020.
- Boortmeerbeek+48.4%
- Geetbets+42.3%
- Landen+41.4%
- Aarschot+39.9%
- Affligem+35.7%
Where is a house cheapest against local incomes in Flemish Brabant province?
Bever is where a house is cheapest against local incomes in Flemish Brabant province: its 2025 median house price equals 7.7 years of the commune’s median declared income per tax return (2023).
- Bever7.7 years
- Zoutleeuw7.7 years
- Landen8.0 years
- Kortenaken8.3 years
- Linter8.4 years
Every commune in Flemish Brabant province by house price (2025)
| Commune | Houses | Apartment median 2025 | For sale now | ||||
|---|---|---|---|---|---|---|---|
| Median 2025 | All-in, only home | Since 2020 | Years of median income | Asking price per m² | |||
| Kraainem | €640,000 | €658,000 | +9.7% | 18.3 | €3,667 | €382,500 | 78 |
| Tervuren | €597,500 | €614,000 | +34.3% | 16.4 | €3,019 | €335,000 | 82 |
| Wezembeek-Oppem | €592,500 | €609,000 | +18.5% | 16.5 | €3,910 | €402,500 | 82 |
| Sint-Genesius-Rode | €572,500 | €589,000 | +20.5% | 16.4 | €3,808 | €327,500 | 167 |
| Overijse | €530,000 | €545,000 | +17.8% | 14.6 | €2,900 | €325,000 | 118 |
| Linkebeek | €505,000 | €520,000 | +24.7% | 15.6 | €3,447 | €269,000 | 29 |
| Bertem | €483,500 | €498,000 | +34.7% | 12.9 | €3,377 | – | 71 |
| Wemmel | €482,500 | €497,000 | +22.2% | 15.4 | €2,819 | €282,500 | 159 |
| Hoeilaart | €477,500 | €492,000 | +26.5% | 13.6 | €2,884 | – | 60 |
| Keerbergen | €475,000 | €489,000 | +19.2% | 12.3 | €2,672 | €400,000 | 144 |
| Oud-Heverlee | €475,000 | €489,000 | +11.8% | 11.3 | €2,810 | – | 46 |
| Meise | €470,000 | €484,000 | +18.8% | 12.9 | €3,029 | €299,500 | 138 |
| Zaventem | €460,000 | €474,000 | +25.3% | 14.5 | €2,750 | €285,000 | 251 |
| Lennik | €460,000 | €474,000 | +21.9% | 12.7 | €2,760 | – | 67 |
| Boortmeerbeek | €460,000 | €474,000 | +48.4% | 11.9 | €2,739 | – | 100 |
| Leuven | €460,000 | €474,000 | +28.5% | 14.2 | €3,286 | €285,000 | 948 |
| Lubbeek | €459,000 | €473,000 | +27.5% | 11.6 | €2,588 | €293,250 | 98 |
| Kortenberg | €455,000 | €469,000 | +26.4% | 12.6 | €2,668 | €312,500 | 100 |
| Grimbergen | €445,000 | €458,000 | +27.5% | 13.1 | €2,869 | €270,000 | 251 |
| Herent | €439,000 | €452,000 | +24.4% | 11.3 | €2,895 | €350,000 | 100 |
| Kampenhout | €436,250 | €449,000 | +20.3% | 11.9 | €2,860 | €332,500 | 97 |
| Steenokkerzeel | €435,000 | €448,000 | +20.8% | 12.2 | €2,785 | – | 62 |
| Beersel | €430,000 | €443,000 | +22.9% | 12.2 | €2,966 | €265,000 | 133 |
| Dilbeek | €430,000 | €443,000 | +26.5% | 12.6 | €2,754 | €280,000 | 291 |
| Bierbeek | €430,000 | €443,000 | +13.2% | 10.7 | €3,000 | €405,000 | 79 |
| Zemst | €429,250 | €442,000 | +26.3% | 10.8 | €2,566 | – | 84 |
| Drogenbos | €419,500 | €432,000 | +23.4% | 14.7 | €2,719 | €285,000 | 28 |
| Pepingen | €412,500 | €425,000 | +16.2% | 11.5 | €3,009 | – | 20 |
| Huldenberg | €405,000 | €417,000 | +20.2% | 11.3 | €2,979 | – | 48 |
| Asse | €400,000 | €412,000 | +26.6% | 12.5 | €2,697 | €230,000 | 298 |
| Haacht | €400,000 | €412,000 | +15.9% | 10.7 | €2,538 | – | 76 |
| Holsbeek | €400,000 | €412,000 | +9.6% | 10.4 | €2,653 | – | 28 |
| Merchtem | €397,500 | €410,000 | +16.9% | 11.5 | €2,592 | €292,500 | 153 |
| Londerzeel | €395,000 | €407,000 | +26.3% | 11.3 | €2,314 | €320,000 | 135 |
| Ternat | €395,000 | €407,000 | +19.7% | 11.1 | €2,475 | – | 94 |
| Rotselaar | €395,000 | €407,000 | +19.3% | 10.2 | €2,592 | €330,000 | 78 |
| Affligem | €380,000 | €392,000 | +35.7% | 10.1 | €2,376 | €307,000 | 68 |
| Boutersem | €380,000 | €392,000 | +26.7% | 9.7 | €2,827 | – | 45 |
| Machelen | €377,000 | €389,000 | +25.7% | 12.4 | €2,593 | €265,000 | 106 |
| Kapelle-op-den-Bos | €375,500 | €387,000 | +20.2% | 10.7 | €2,451 | – | 48 |
| Sint-Pieters-Leeuw | €365,000 | €376,000 | +17.7% | 11.7 | €2,805 | €267,500 | 210 |
| Tremelo | €360,000 | €371,000 | +17.1% | 10.4 | €2,478 | – | 74 |
| Tielt-Winge | €360,000 | €371,000 | +28.3% | 10.4 | €2,533 | €324,500 | 102 |
| Roosdaal | €359,500 | €371,000 | +12.3% | 9.9 | €2,574 | – | 90 |
| Vilvoorde | €354,000 | €365,000 | +20.4% | 11.5 | €2,362 | €264,500 | 266 |
| Pajottegem | €350,000 | €361,000 | +17.4% | – | €2,589 | €275,000 | 171 |
| Opwijk | €348,000 | €359,000 | +16.0% | 9.7 | €2,291 | €240,000 | 108 |
| Glabbeek | €345,000 | €356,000 | +12.2% | 9.2 | €2,458 | – | 32 |
| Begijnendijk | €343,000 | €354,000 | +17.5% | 9.5 | €2,500 | – | 88 |
| Aarschot | €336,000 | €347,000 | +39.9% | 10.1 | €2,256 | €303,000 | 189 |
| Hoegaarden | €336,000 | €347,000 | +20.0% | 9.1 | €2,291 | €304,000 | 69 |
| Halle | €333,000 | €344,000 | +25.2% | 10.3 | €2,391 | €269,500 | 250 |
| Liedekerke | €320,000 | €330,000 | +19.9% | 9.8 | €2,260 | €245,500 | 86 |
| Bekkevoort | €317,500 | €328,000 | +15.5% | 9.6 | €2,544 | – | 52 |
| Geetbets | €304,500 | €315,000 | +42.3% | 9.3 | €1,939 | – | 52 |
| Linter | €300,000 | €310,000 | +21.2% | 8.4 | €1,906 | – | 52 |
| Scherpenheuvel-Zichem | €295,000 | €305,000 | +34.1% | 8.8 | €2,040 | €290,000 | 233 |
| Kortenaken | €290,000 | €300,000 | +20.8% | 8.3 | €2,202 | – | 54 |
| Diest | €285,000 | €295,000 | +19.2% | 8.6 | €2,171 | €245,000 | 124 |
| Landen | €280,000 | €289,000 | +41.4% | 8.0 | €1,967 | €200,000 | 104 |
| Tienen | €273,750 | €283,000 | +30.4% | 8.8 | €1,806 | €213,000 | 239 |
| Bever | €262,500 | €272,000 | – | 7.7 | €2,425 | – | 23 |
| Zoutleeuw | €252,000 | €261,000 | +14.5% | 7.7 | €1,921 | – | 60 |