Original data
Affordable municipalities near major Belgian cities
By Matthieu BrouillardUpdated 8-minute read
The short answer
To find a cheaper municipality near a Belgian city, start from a rule you can reproduce. This guide takes the municipalities bordering Brussels, Antwerp, Ghent, Leuven, Mechelen, Liège, Namur, Charleroi and Mons and ranks them by median house price. Beside each price: the change over five years, the years of local income it costs, the asking price per m², how much house €350,000 buys and the typical morning train into the city. Condition still needs a separate check.
Found a cheaper area? Check the actual home next
A municipal median can’t see the condition, street or asking-price premium. Paste the listing to run the address-level check.
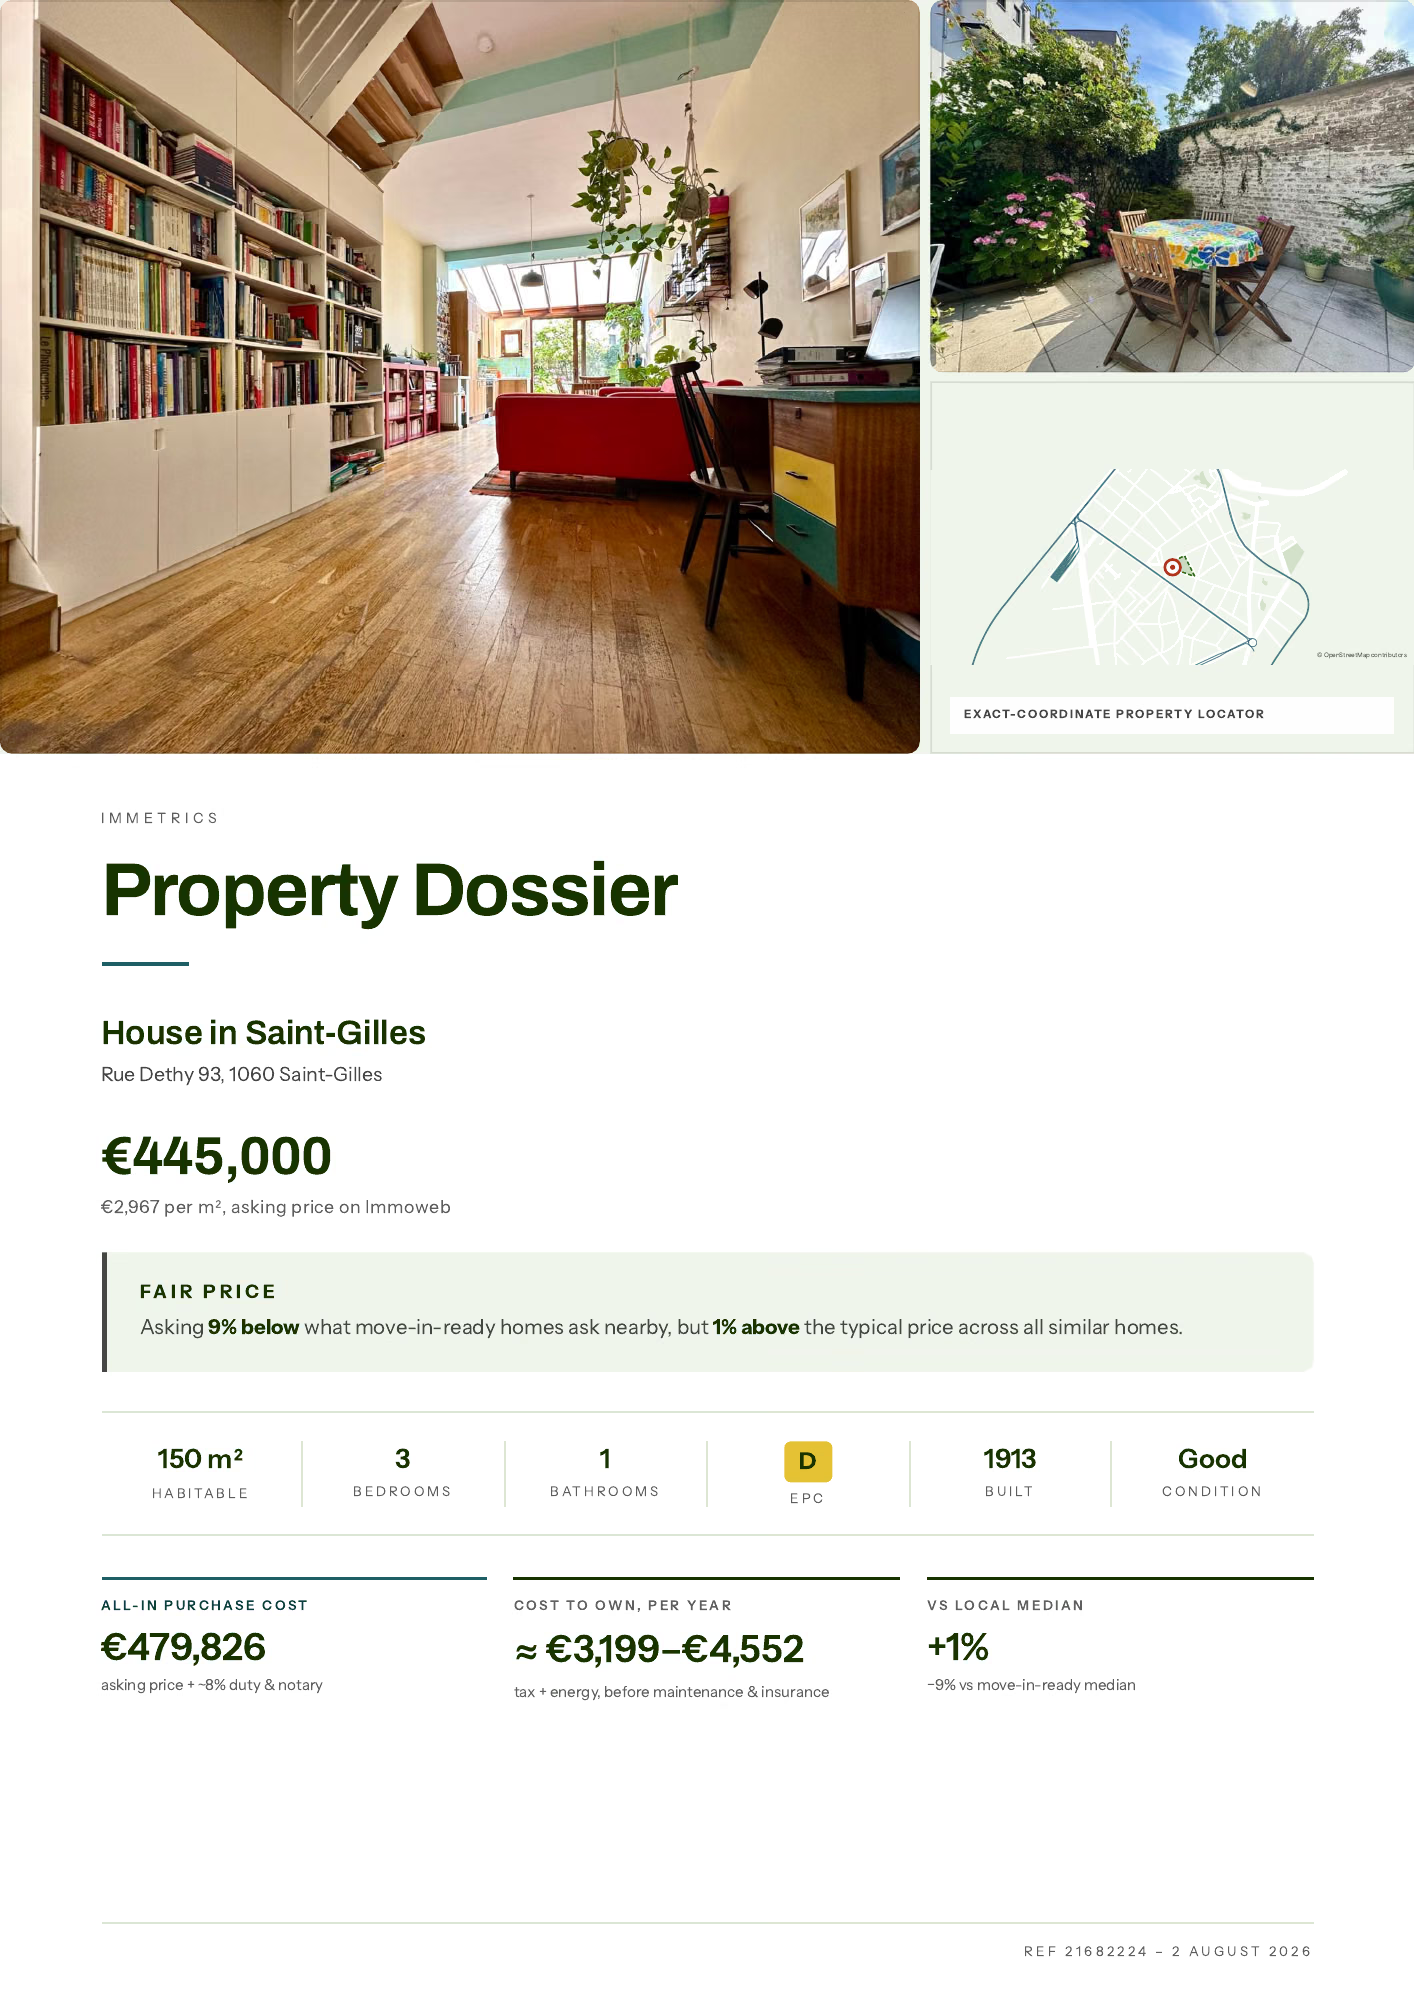 The verdict up front: where the asking price sits, the cash you need on day one, and what it costs each monthOpen the full 11-page sample
Affordable municipalities bordering nine cities in 2025
For each city, the bordering municipalities where a house sold for the least in 2025, cheapest first. Years of income divides the median house price by the municipality’s median declared income per tax return in 2023: that’s one return’s income, not a household’s. The price per m² and the floor area it buys are asking prices of houses for sale, because a deed doesn’t record the surface.
Brussels
Where to buy a house near Brussels for less: its bordering municipalities, cheapest first. In Brussels itself, the median house sold for €430,000 in 2025.
| Municipality | Median house, 2025 | Change over 5 years | Years of income | Asking price per m² | m² for €350,000 | Typical train to Bruxelles-Central, minutes | House sales |
|---|---|---|---|---|---|---|---|
| Anderlecht | €341,000 | +14% | 14.9 | €2,333 | 150 m² | 201 | |
| Molenbeek-Saint-Jean | €350,000 | +9% | 15.4 | €2,292 | 155 m² | 62 | |
| Vilvoorde | €354,000 | +20% | 11.5 | €2,362 | 150 m² | 14 | 335 |
| Saint-Josse-ten-Noode | €357,500 | +4% | 17.6 | €2,273 | 155 m² | 26 | |
| Machelen | €377,000 | +26% | 12.4 | €2,593 | 135 m² | 18Diegem | 127 |
| Jette | €425,000 | +31% | 16.6 | €2,494 | 140 m² | 82 |
Antwerp
Where to buy a house near Antwerp for less: its bordering municipalities, cheapest first. In Antwerp itself, the median house sold for €369,000 in 2025.
| Municipality | Median house, 2025 | Change over 5 years | Years of income | Asking price per m² | m² for €350,000 | Typical train to Antwerpen-Centraal, minutes | House sales |
|---|---|---|---|---|---|---|---|
| Hemiksem | €300,000 | +18% | 8.7 | €2,281 | 155 m² | 21 | 109 |
| Beveren-Kruibeke-Zwijndrecht | €338,000 | +28% | – | €2,269 | 155 m² | 22Beveren | 926 |
| Stabroek | €375,000 | +29% | 10.5 | €2,510 | 140 m² | 212 | |
| Wijnegem | €389,000 | +17% | 11.8 | €2,935 | 120 m² | 81 | |
| Schoten | €415,000 | +30% | 12.4 | €2,771 | 125 m² | 412 | |
| Wommelgem | €415,000 | +29% | 12.4 | €2,706 | 130 m² | 128 |
Ghent
Where to buy a house near Ghent for less: its bordering municipalities, cheapest first. In Ghent itself, the median house sold for €386,100 in 2025.
| Municipality | Median house, 2025 | Change over 5 years | Years of income | Asking price per m² | m² for €350,000 | Typical train to Gent-Sint-Pieters, minutes | House sales |
|---|---|---|---|---|---|---|---|
| Zelzate | €275,000 | +25% | 8.7 | €2,090 | 165 m² | 155 | |
| Evergem | €363,000 | +22% | 10.3 | €2,720 | 130 m² | 23 | 401 |
| Deinze | €363,052 | +17% | 10.7 | €2,423 | 145 m² | 14 | 411 |
| Lievegem | €370,000 | +32% | 10.7 | €2,638 | 135 m² | 32Waarschoot | 289 |
| Merelbeke-Melle | €412,589 | +25% | – | €2,594 | 135 m² | 6Merelbeke | 386 |
| Lochristi | €419,000 | +20% | – | €2,696 | 130 m² | 20Beervelde | 296 |
Leuven
Where to buy a house near Leuven for less: its bordering municipalities, cheapest first. In Leuven itself, the median house sold for €460,000 in 2025.
| Municipality | Median house, 2025 | Change over 5 years | Years of income | Asking price per m² | m² for €350,000 | Typical train to Leuven, minutes | House sales |
|---|---|---|---|---|---|---|---|
| Rotselaar | €395,000 | +19% | 10.2 | €2,592 | 135 m² | 7Wezemaal | 165 |
| Haacht | €400,000 | +16% | 10.7 | €2,538 | 140 m² | 15 | 150 |
| Holsbeek | €400,000 | +10% | 10.4 | €2,653 | 130 m² | 100 | |
| Bierbeek | €430,000 | +13% | 10.7 | €3,000 | 115 m² | 105 | |
| Herent | €439,000 | +24% | 11.3 | €2,895 | 120 m² | 5 | 214 |
| Lubbeek | €459,000 | +28% | 11.6 | €2,588 | 135 m² | 150 |
Mechelen
Where to buy a house near Mechelen for less: its bordering municipalities, cheapest first. In Mechelen itself, the median house sold for €364,000 in 2025.
| Municipality | Median house, 2025 | Change over 5 years | Years of income | Asking price per m² | m² for €350,000 | Typical train to Mechelen, minutes | House sales |
|---|---|---|---|---|---|---|---|
| Willebroek | €325,000 | +33% | 10.2 | €2,290 | 155 m² | 12 | 308 |
| Rumst | €350,000 | +28% | 9.8 | €2,529 | 140 m² | 162 | |
| Kapelle-op-den-Bos | €375,500 | +20% | 10.7 | €2,451 | 145 m² | 7 | 89 |
| Zemst | €429,250 | +26% | 10.8 | €2,566 | 135 m² | 10Eppegem | 251 |
| Sint-Katelijne-Waver | €431,250 | +34% | 12.5 | €2,599 | 135 m² | 8 | 216 |
| Boortmeerbeek | €460,000 | +48% | 11.9 | €2,739 | 130 m² | 11 | 141 |
Liège
Where to buy a house near Liège for less: its bordering municipalities, cheapest first. In Liège itself, the median house sold for €206,500 in 2025.
| Municipality | Median house, 2025 | Change over 5 years | Years of income | Asking price per m² | m² for €350,000 | Typical train to Liège-Guillemins, minutes | House sales |
|---|---|---|---|---|---|---|---|
| Seraing | €180,000 | +27% | 7.2 | €1,613 | 215 m² | 11 | 671 |
| Saint-Nicolas | €185,000 | +32% | 7.2 | €1,583 | 220 m² | 260 | |
| Herstal | €200,000 | +26% | 7.7 | €1,602 | 220 m² | 15 | 379 |
| Beyne-Heusay | €215,000 | +28% | 7.8 | €1,653 | 210 m² | 144 | |
| Ans | €230,000 | +28% | 8.2 | €1,719 | 205 m² | 7 | 278 |
| Oupeye | €260,000 | +33% | 9.0 | €1,758 | 200 m² | 231 |
Namur
Where to buy a house near Namur for less: its bordering municipalities, cheapest first. In Namur itself, the median house sold for €305,000 in 2025.
| Municipality | Median house, 2025 | Change over 5 years | Years of income | Asking price per m² | m² for €350,000 | Typical train to Namur, minutes | House sales |
|---|---|---|---|---|---|---|---|
| Andenne | €249,000 | +25% | 8.8 | €1,837 | 190 m² | 16 | 260 |
| Jemeppe-sur-Sambre | €260,000 | +41% | 8.7 | €1,630 | 215 m² | 23 | 210 |
| Floreffe | €295,000 | +18% | 8.8 | €2,375 | 145 m² | 13 | 65 |
| Assesse | €325,000 | +32% | 9.5 | €2,080 | 170 m² | 23 | 53 |
| Eghezée | €330,000 | +20% | 10.0 | €2,108 | 165 m² | 139 | |
| Gembloux | €330,000 | +27% | 10.2 | €2,151 | 165 m² | 13 | 200 |
Charleroi
Where to buy a house near Charleroi for less: its bordering municipalities, cheapest first. In Charleroi itself, the median house sold for €158,000 in 2025.
| Municipality | Median house, 2025 | Change over 5 years | Years of income | Asking price per m² | m² for €350,000 | Typical train to Charleroi-Central, minutes | House sales |
|---|---|---|---|---|---|---|---|
| Châtelet | €175,000 | +30% | 7.0 | €1,279 | 275 m² | 8 | 372 |
| Courcelles | €175,000 | +17% | 6.5 | €1,333 | 265 m² | 12Courcelles-Motte | 326 |
| Fontaine-l’Evêque | €186,000 | +28% | 7.0 | €1,384 | 255 m² | 11Forchies | 153 |
| Fleurus | €200,000 | +21% | 7.4 | €1,807 | 195 m² | 11 | 231 |
| Pont-à-Celles | €250,000 | +15% | 7.8 | €1,967 | 180 m² | 14Luttre | 165 |
| Les Bons Villers | €265,000 | +26% | 8.4 | €2,266 | 155 m² | 102 |
Mons
Where to buy a house near Mons for less: its bordering municipalities, cheapest first. In Mons itself, the median house sold for €190,000 in 2025.
| Municipality | Median house, 2025 | Change over 5 years | Years of income | Asking price per m² | m² for €350,000 | Typical train to Mons, minutes | House sales |
|---|---|---|---|---|---|---|---|
| Quaregnon | €139,000 | +24% | 5.7 | €1,106 | 315 m² | 8 | 163 |
| Frameries | €140,000 | +12% | 5.4 | €1,389 | 250 m² | 5 | 230 |
| Binche | €175,000 | +23% | 6.5 | €1,252 | 280 m² | 40Leval | 360 |
| La Louvière | €180,000 | +24% | 7.0 | €1,203 | 290 m² | 16La Louvière-Sud | 634 |
| Quévy | €190,000 | +10% | 6.1 | €1,775 | 195 m² | 8Genly | 79 |
| Saint-Ghislain | €210,000 | +27% | 7.5 | €1,809 | 195 m² | 8 | 196 |
Sale prices: Statbel, recorded deeds, processed on 14 October 2026. Asking prices: houses for sale on Immoweb on 26 October 2026. A dash marks a figure that isn’t published: too few sales or listings, or a municipality merged in 2025, whose income is only published for the municipalities it was made from.
Train: the typical weekday-morning train from the municipality’s own station to the city’s main station, arriving between 8:15 and 9:00 on 15 October 2026, a school-term weekday, by the SNCB timetable. The way to the station isn’t counted; the station is named under the minutes when it doesn’t bear the municipality’s name.
Source: SNCB/NMBS open data, 27 September 2026
How should you use these rankings?
- Treat the median as a market anchor: It’s the middle recorded house sale of the year, not the price of every home in the municipality. The sales column says how many deeds it rests on, and a small market can jump on a few of them.
- Read years of income as a ratio: It sets the median house against the income of a typical local tax return. A low figure means houses are cheap for local incomes; it isn’t what a bank will lend you.
- Compare what your budget buys: The m² column divides €350,000 by the asking price per m² of houses for sale. It shows how much more house the same money buys one municipality over, not what a given house will cost.
- Test the real journey: The train column runs station to station: the way to the station and on from the city station come on top, and a border says nothing about the drive. Check the exact address at the hour you’d normally travel.
- Compare the actual listing: Condition, EPC, land and immediate work can erase a municipality-level price advantage.
Methodology and limitations
immetrics joins Statbel’s municipal sale prices to a shared-border map built from Belgian municipal polygons. For each of the nine cities, the bordering municipalities with a published house median are sorted from lowest to highest, and the six cheapest are shown.
Asking prices per m² are the median of the houses for sale on Immoweb with a stated living area: what’s on the market now, not what sold.
The ranking doesn’t claim that the first row has the cheapest current listing or the fastest commute. Municipal medians mix different sizes and conditions, and a border may be far from the city centre.
Frequently asked questions
Sources and methodology
Rules and figures are time-sensitive. Check the linked official source before making a financial or legal decision. Methodology
- Real-estate open data – Statbel
- Taxable income by municipality – Statbel
- Houses for sale (asking prices) – Immoweb
- NMBS/SNCB timetable (GTFS, CC BY 4.0) – Belgian Mobility Company
- Belgian municipality boundaries – Opendatasoft