Province of Antwerp – Flanders
Property prices in Niel
In 2025, the median sale price in Niel was €302,500 for a house (168 sales) and €244,000 for an apartment (55 sales), according to Statbel. The latest figures: in the first half of 2026, the median house sold for €327,500, against €290,000 in the first half of 2025.
Median house, first half of 2026
€327,500
+12.9% on Jan–Jun 2025 (€290,000), 55 sales
Median house, 2025
€302,500
Middle 50% of sales: €230,000–€369,750
Median apartment, first half of 2026
€256,500
+8.2% on Jan–Jun 2025 (€237,000), 33 sales
Median apartment, 2025
€244,000
Middle 50% of sales: €219,000–€300,000
Bought at the 2025 median of €302,500 as your only home, a house in Niel costs about €312,000 all-in, with registration tax and notary fees. Borrowing 80% of the price adds about €4,800 for the mortgage deed. The true cost of buying a home in Belgium, item by item
Work out what your savings and income can buy
Eyeing a home in Niel?
Paste the link of a home on Immoweb, Belgium’s main property site, and get a free 11-page report: the asking price checked against comparable listings and recorded sales, the true monthly cost, and the red flags.
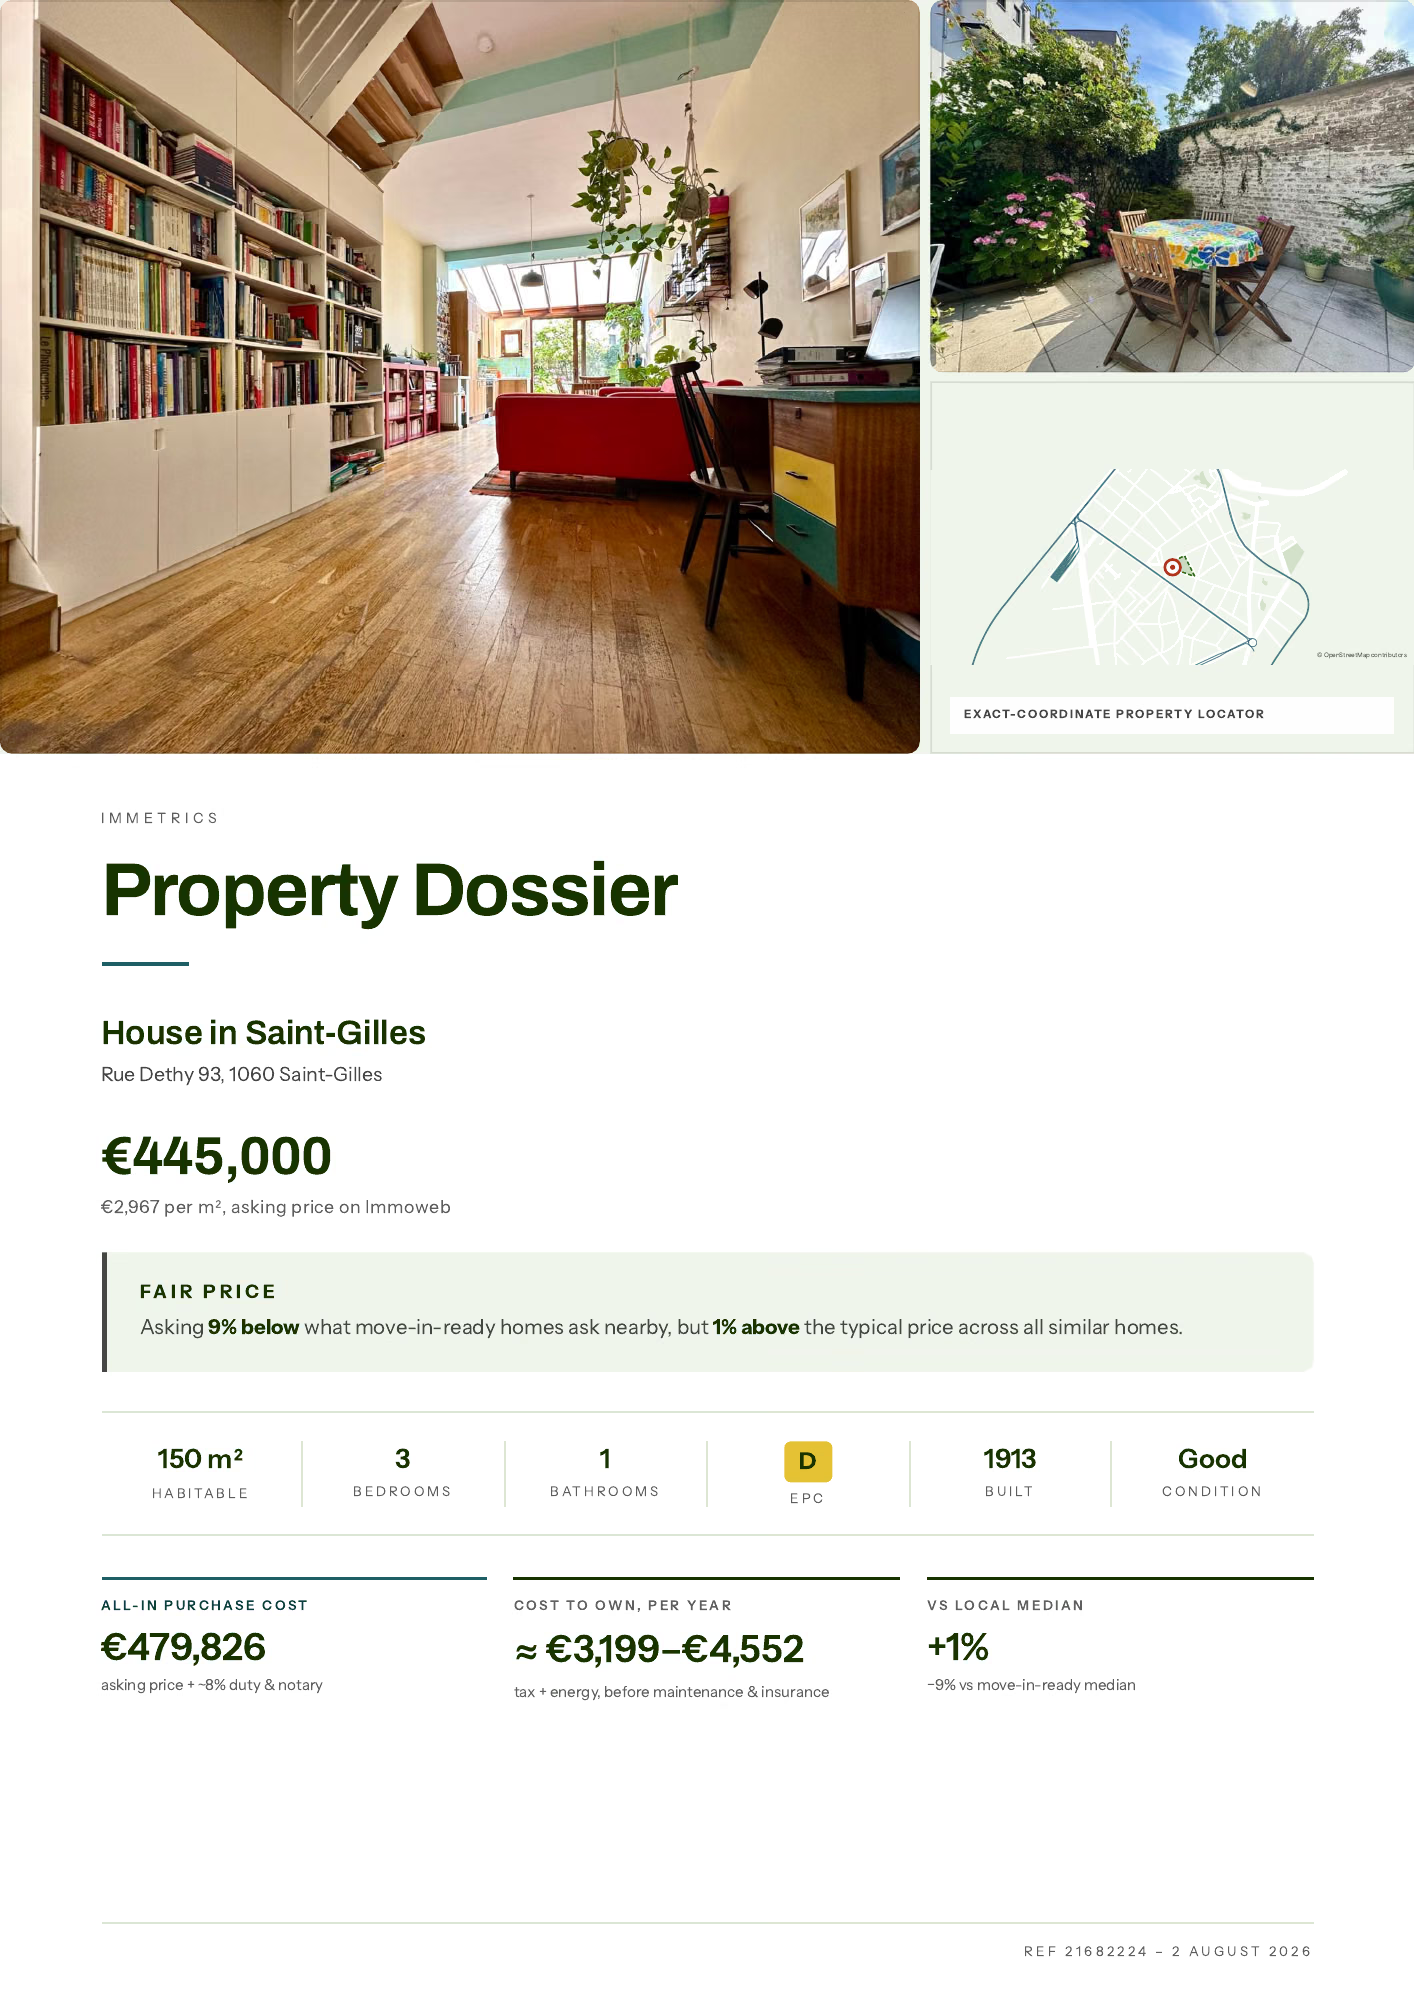 The verdict up front: where the asking price sits, the cash you need on day one, and what it costs each monthOpen the full 11-page sample
House and apartment prices in Niel, by type
| Property type | Median price 2025 | Middle 50% of sales | Sales |
|---|---|---|---|
| Terraced or semi-detached house | €295,000 | €230,000–€365,000 | 162 |
| Apartment | €244,000 | €219,000–€300,000 | 55 |
First half of 2026, against the first half of 2025
| Property type | First half of 2025 | First half of 2026 | Change | Sales, Jan–Jun 2026 |
|---|---|---|---|---|
| All houses | €290,000 | €327,500 | +12.9% | 55 |
| Terraced or semi-detached house | €290,000 | €325,000 | +12.1% | 52 |
| Apartment | €237,000 | €256,500 | +8.2% | 33 |
In 2025, 223 homes (168 houses and 55 apartments) changed hands in Niel, 42.9% more than in 2024. Niel is a house market first: apartments made up only 25% of 2025 sales.
Asking price per m² in Niel
| Property type | Median asking price per m² |
|---|---|
| Houses | €2,026/m² |
| Apartments | €2,685/m² |
On 26 October 2026, 54 houses and 15 apartments in Niel were advertised for sale on Immoweb. Immoweb marked 17% of the houses and 13% of the apartments as under offer.
Median sale price in Niel since 1980
HousesApartmentsShaded: middle 50% of sales
In 1980, the median house in Niel sold for €17,353, and in 2000 for €61,973 (Belgian francs converted to euros); today it is €302,500, about 17 times as much as in 1980.
How prices are moving
In Niel, the median house price rose 8% in 2025, 38.1% over five years and 64.4% over ten years; the median apartment price fell 9% in 2025, but rose 22% over five years and 28.4% over ten years. The latest figures: in the first half of 2026, the median house sold for €327,500, against €290,000 in the first half of 2025.
| 2024–2025 | 2020–2025 | 2015–2025 | |
|---|---|---|---|
| Houses | +8.0% | +38.1% | +64.4% |
| Apartments | −9.0% | +22.0% | +28.4% |
Price history in Niel, year by year
| Year | Median house | Median apartment |
|---|---|---|
| 2025 | €302,500 | €244,000 |
| 2024 | €280,000 | €268,000 |
| 2023 | €259,000 | €230,000 |
| 2022 | €260,000 | €229,000 |
| 2021 | €260,000 | €199,500 |
| 2020 | €219,000 | €200,000 |
| 2019 | €222,500 | €210,000 |
| 2018 | €215,000 | €194,750 |
| 2017 | €185,000 | €176,150 |
| 2016 | €190,000 | €206,000 |
| 2015 | €184,000 | €190,000 |
| 2014 | €180,000 | €191,250 |
| 2013 | €185,000 | €188,500 |
| 2012 | €180,000 | €152,500 |
| 2011 | €157,250 | €164,000 |
| 2010 | €168,500 | €164,500 |
Compared with the province and Belgium
| Niel | Province of Antwerp | Belgium | |
|---|---|---|---|
| Median house price | €302,500 | €380,000 | €315,000 |
| Median apartment price | €244,000 | €259,000 | €250,000 |
Over ten years, the median house price in Niel rose 64.4%, against a 57.5% rise across Belgium.
Niel has the 5th lowest 2025 median house price in Antwerp province.
Prices by neighbourhood in Niel (2024)
For a house, the highest median is in Niel – Dorp-West (€319,000) and the lowest in Hellegat – Steenbakkerijen (€250,000).
| Statistical sector | Median house | Median apartment |
|---|---|---|
| Niel – Dorp-West | €319,000 | – |
| Niel-Centrum | €290,000 | €255,000 |
| Hellegat – Steenbakkerijen | €250,000 | – |
Who lives in Niel
Incomes run above the Belgian median: the typical tax declaration in Niel showed €33,645 in 2023, 12% more than nationally. Most households here own their home: 78% did at the 2021 census, against 65% across Belgium. Niel is gaining residents: the population rose 9.1% between 2016 and 2026, to 11,059.
Flood and soil in Niel
Parts of Niel are exposed: 5.9% of the commune’s area lies in a medium or high flood-hazard zone, plus 11.7% in the low class. 1,147 parcels in Niel are listed in the OVAM soil register (a known or suspected contamination history). Flood and soil are two of the checks to run on one specific home before you sign; our guide to what to check before making an offer covers the rest.
Estimate a house or apartment in Niel
Frequently asked questions
Got a listing in mind?
Paste the link and have the full report before you make an offer, because an accepted offer binds you. Getting this wrong costs thousands. Checking costs nothing.
Nearby communes
On median house prices, Niel lands between Boom (€275,000) and Bornem (€340,754).
| Commune | House median | Apartment median |
|---|---|---|
| Boom | €275,000 | €220,000 |
| Bornem | €340,754 | €275,000 |
| Rumst | €350,000 | €283,750 |
| Puurs-Sint-Amands | €380,000 | €285,000 |
| Schelle | €385,000 | €280,000 |
| Aartselaar | €442,500 | €260,000 |